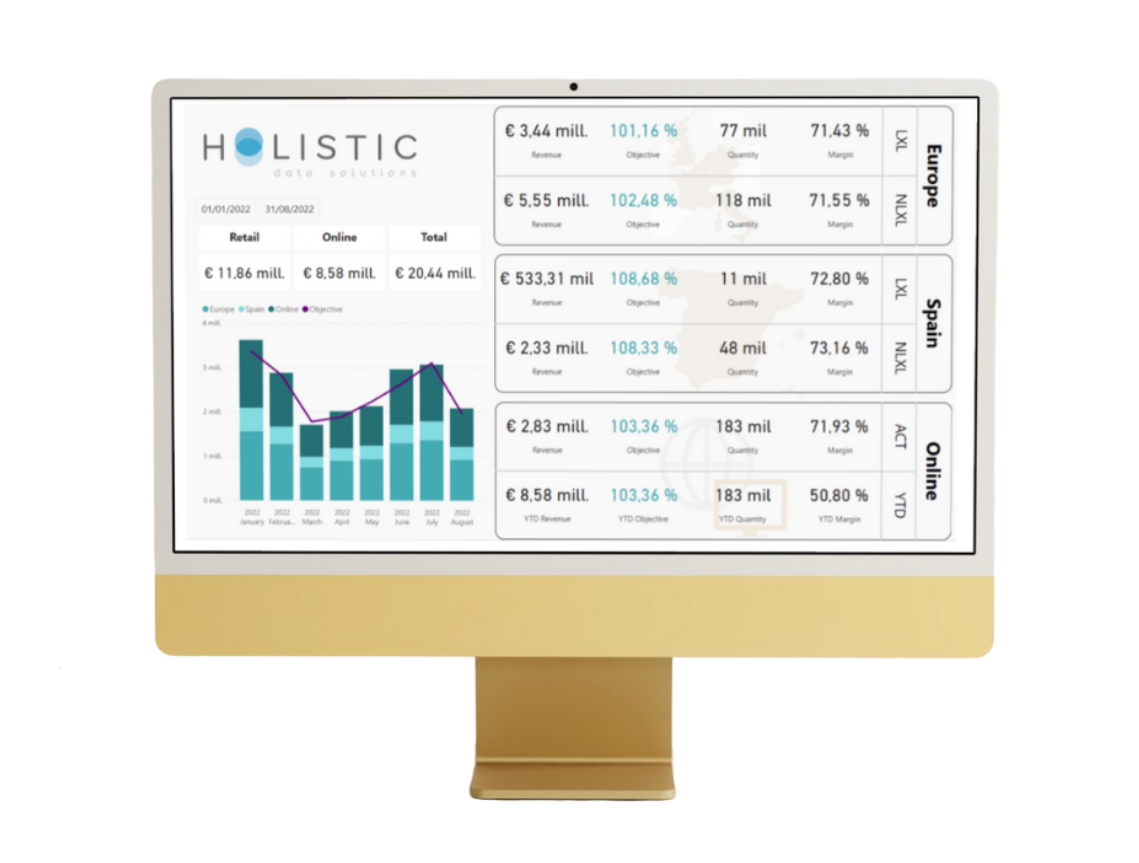


Connect and visualize all your business data. Power BI turns your ideas into impactful visual reports thanks to advanced data analysis tools and Artificial Intelligence....

Article about the role of purchasing in retail and the importance of purchasing reporting in retail results

Connect and visualize all your business data. Power BI turns your ideas into impactful visual reports thanks to advanced data analysis tools and Artificial Intelligence....

The final project is a Power BI solution that integrates sales and stock information for the entire company. Its flexibility allows a global vision at a strategic level for the...